

Introduction To Decision Trees - Part 1
Day #1of100


A Decision Tree is majorly used as a classification algorithm under supervised learning.
What is a Classification Algorithm?
In the Classification Algorithms, we divide datasets into different categories or groups by adding labels. Example: Spam Labeler is used to label spam or not spam in the mail, Fraud detection in credit card use, fruit classification etc. It is used to do predictive analysis.
What is Predictive Analysis?
Predictive analytics uses statistical techniques and machine learning techniques to use historical data to predict future events.
Types of Classification Algorithms
A Decision Tree is the graphical representation of all possible solutions to a decision. Decisions are based on some conditions.
Random Forest builds multiple decision trees and merges them to get more accurate and stable predictions. Usually, decision trees tend to over-fit the training dataset. Random Forest by merging multiple decision trees corrects this tendency. It is trained with the bagging method.
Naive Bayes: It is a classification technique based on Bayes' Theorem. It assumes that the presence of a particular feature in a class is entirely unrelated to the presence of any other feature. It outperforms most algorithms for small datasets.
KNN Algorithm: It stores all the available cases and classifies new cases based on a similarity measure. The K in KNN algorithm is the nearest neighbor we wish to take votes.
Decision Tree Terminologies
Root Node: It represents the entire population or sample and this further gets divided into two or more homogeneous sets.
Leaf Node: Node can't be further segregated into further nodes.
Splitting: Dividing the root node/sub node into different parts on the basis of some condition.
Branch/Sub Tree: Formed by splitting the tree (or node).
Pruning: Opposite of splitting, basically removing the unwanted branches from the tree.
Parent/Child Node: Root node is the parent node and all the other nodes branched from it's known as the child node.
CART Algorithm
Gini Index: The measure of impurity (or purity) used in building decision tree in CART is Gini Index.
Information Gain: Decrease in entropy after a dataset is split on the basis of an attribute. Constructing a decision tree is finding the attribute that returns the highest information gain.
Reduction in Variance: Used for continuous target variables/regression problems. The split with the lower variance is selected as the criteria to split the population.
Chi-Square: Statistical significance between the differences between sub nodes and parent nodes.
Entropy: metric to measure impurity
Example: There are four real apples in a basket and four labels namely apple in a container. Now you pick randomly an apple from the basket and one label from the container. There is no chance that the randomly picked label will not match the fruit. In this case, Impurity=0.
Example: There are four real different fruits in the basket namely apple, banana, grape and orange. And there are 4 different labels as apple, banana, grape and orange in the container. Now you randomly pick a label and a fruit. There is always a chance that the randomly picked label will not match the fruit. In this case, Impurity≠0.
Mathematically, $$Entropy =-P(yes)log_2P(yes)-P(no)log_2P(no)$$
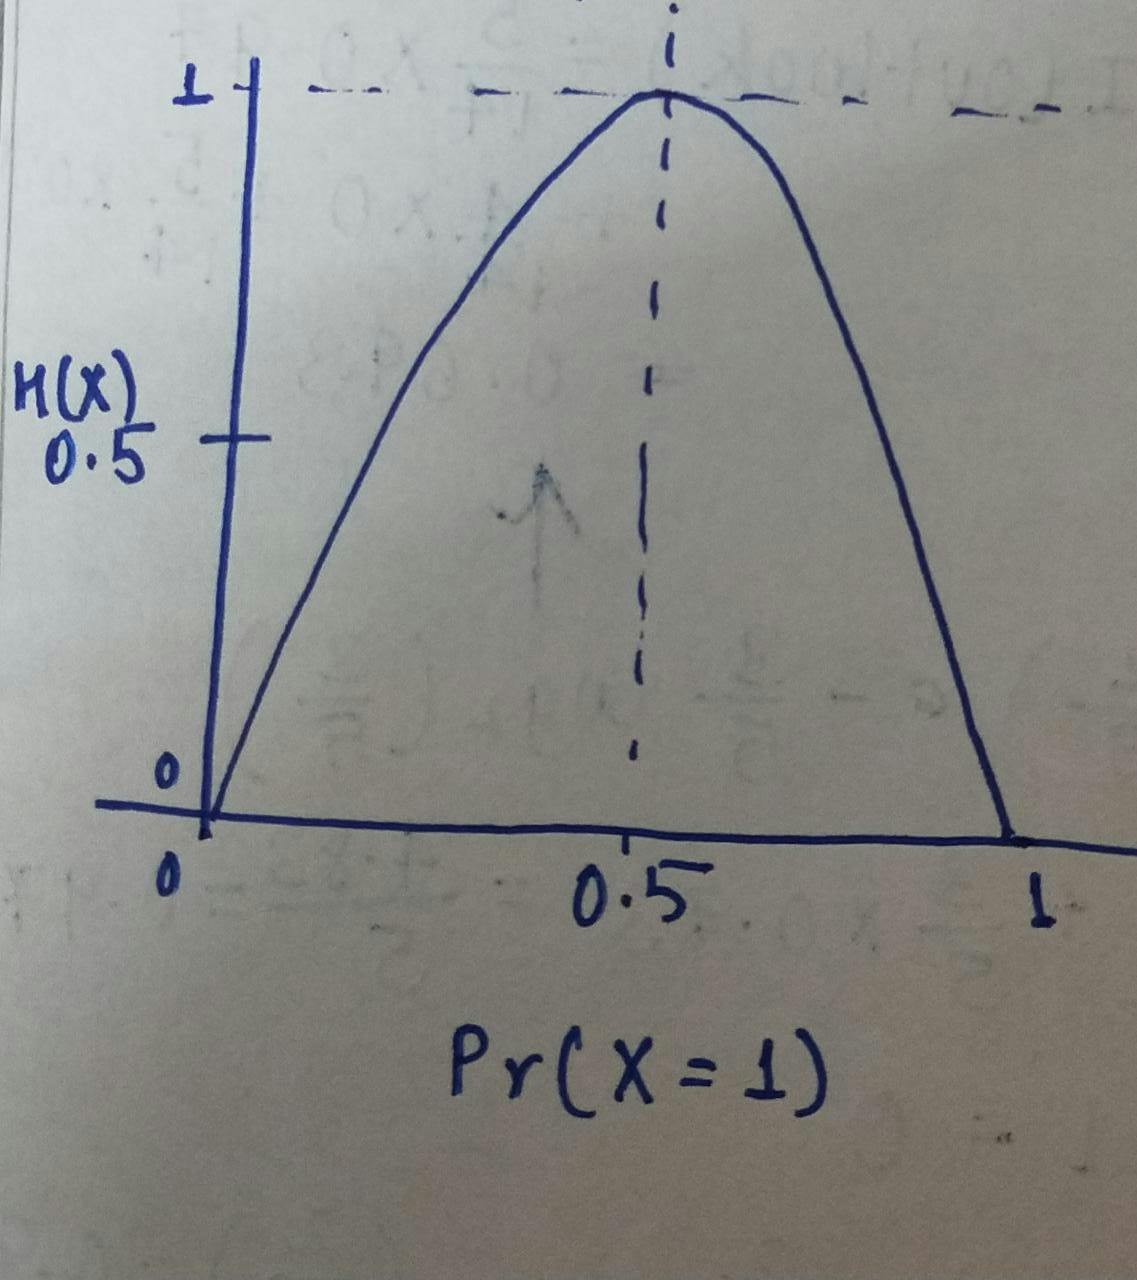
Now let's understand an example of entropy graphically,
S: Total sample space
P(yes): Probability of yes
P(no): Probability of no
E(S): Entropy on the given sample space
Let no of yes =no of no =0.5
Then the entropy = 1.
$$E(S) =-P(yes)log_2P(yes)-P(no)log_2P(no)$$ $$E(S) =-0.5log_2(0.5)-0.5log_2(0.5)$$ $$E(S)=-0.5(log_2(0.5)+log_2(0.5))$$ $$E(S)=-0.5(2log_2(0.5))$$ $$E(S)=(-0.5)(2)(-1)$$ $$E(S)=1$$
We can also the graph peaked at the middle and the value became 1.
For all yes, that is the probability of getting the labels same as fruits as the given example: $$E(S)=-1log_2(1)-0log_2(0)=-1(0)=0$$
For all no, that is the probability of getting no labels same as fruits: $$E(S)=-0log_2(0)-1log_2(1)=-1(0)=0$$
Since this article was getting too long, I decided to split the article into two halves. Continued in Part 2
References: